📑 Reviewing the report
In this section, you will learn how to review the results generated by the platform. Once you have uploaded an image, you will be automatically redirected to the Review report page, where you can see the results produced by the AI algorithm.
Structure of the report
When you open a report, you will see a box with the following heading:
As you can see, the report has three tabs:
- Lesion
- Follow up
- Clarifications
Each tab contains different information about results of the AI analysis. You can navigate between the tabs to access the information you need.
Lesion tab
Clicking on the Lesion tab will display the results of the AI analysis. This tab contains the following information:
- Total Automatic SALT (ASALT) score: At the top, you can see the total ASALT score. This is the combined score calculated from the four images. This is the most important score to monitor.
- Local Automatic SALT (ASALT) scores: Further down, you can see the local ASALT scores. Local scores are derived for each individual region of the scalp (top, back, left, and right).
ASALT
Score: 55
Report Information
Timestamp
6/18/2026, 2:54:53 PM
Analysis performed in
1.2 seconds
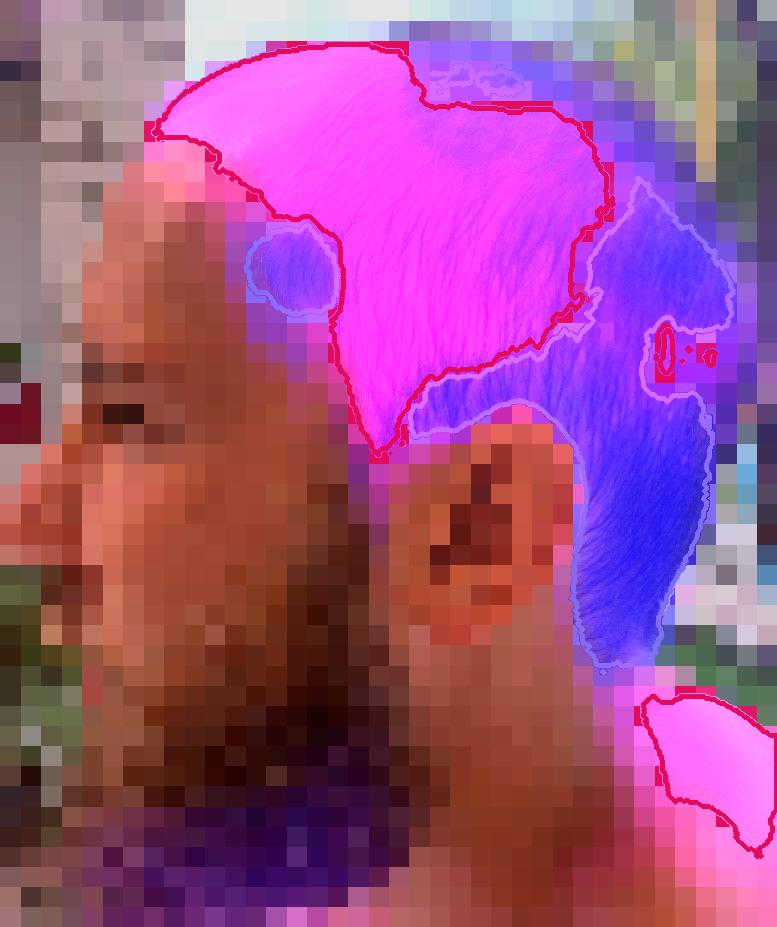
Body site
Left of the head
Image quality
68%
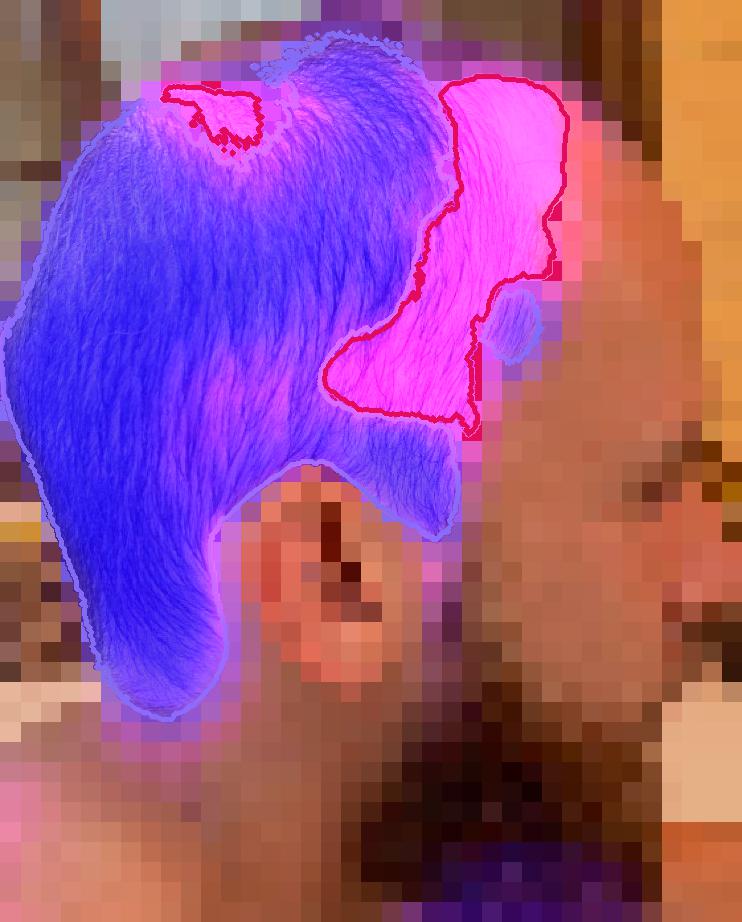
Body site
Right of the head
Image quality
66%
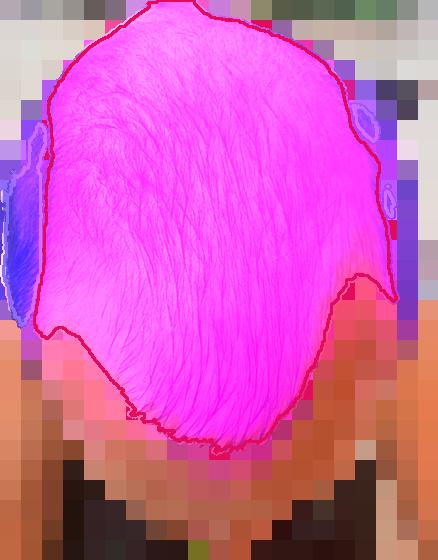
Body site
Top of the head
Image quality
63%
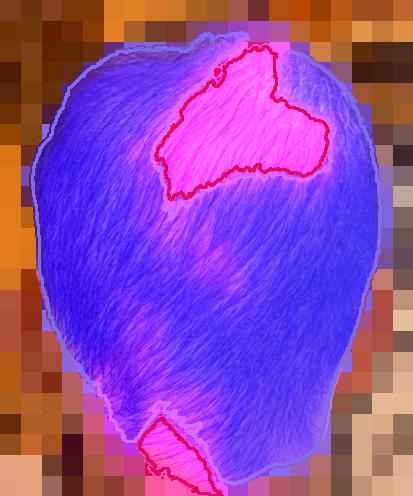
Body site
Back of the head
Image quality
55%
Follow-up tab
Clicking on the Follow up tab will display the information about the evolution. In other words, this tab will show how the ASALT score has evolved over time comparing that visit’s photos to the set of baseline images.
If the ASALT score has increased by 25% or more since the Baseline visit, the site will receive an email informing of such an occurrence. Refer to the protocol for next steps.
Clarifications tab
You can ignore this tab, as it is not relevant to the current study.
Interpret results
About the ASALT score
Through the Legit.Health platform, the PI monitors events related to hair thinning/loss by taking photographs of patients. These photographs are analyzed by the artificial intelligence and scored according to the Automatic Severity of Alopecia Tool (ASALT).
Ranges
The total Automatic SALT (ASALT) score is calculated from AI analysis of 4 uploaded scalp images: top, back, left, and right. Each image corresponds to a specific region, and the combined, weighted scores from these four images yield the total ASALT score. This approach provides a comprehensive view of hair thinning or loss across the entire scalp.
Table 1: Total ASALT score ranges and severity
| Range Min | Range Max | Severity Label | Severity |
|---|---|---|---|
| 0 | 0 | None | 1 |
| 0 | 24 | Limited | 1 |
| 25 | 49 | Moderate | 2 |
| 50 | 74 | Severe | 3 |
| 75 | 100 | Very Severe | 3 |
Additionally, local SALT scores are derived for each individual region of the scalp (top, back, left, and right). These local scores help pinpoint areas of significant potential hair loss by measuring each region's severity on its scale.